Penetration Testing Tools That Perform Automated Data-Flow Tracing Across Source Code
Data-flow tracing finds real vulnerabilities by following input to dangerous sinks.
A typical CI/CD pipeline hands a security team a report with hundreds of findings, and most of them turn out to be noise. That happens because most scanners wired into those pipelines just match syntax patterns against known-bad signatures. They look for shapes in code that resemble past vulnerabilities, a check on surface resemblance rather than the actual movement of data through a running application. That's a fundamentally shallower operation than tracing how a piece of input travels from where it enters a program to where it causes damage.
Pattern matching is good at spotting what looks dangerous sitting by itself on a single line. It has no way to catch a vulnerability that only becomes visible once you connect pieces scattered across multiple files, functions, or call boundaries. A scanner can tell a team that a SQL query exists somewhere in the codebase and that user input exists somewhere else. Only a data-flow tracer can answer the question that actually matters: does that specific input reach that specific query without passing through a sanitization step along the way.
That distinction decides what a team gets back from its tooling. When a tool traces data flow, it produces findings an engineer can act on directly. A tool that only pattern-matches produces a list of maybes, each one requiring a human to manually trace the code by hand to confirm whether it's a genuine vulnerability. One of those outputs is a working exploit path. The other is an unconfirmed alert sitting in a queue, indistinguishable at a glance from hundreds of others just like it.
Taint analysis: marking untrusted input and following it to a dangerous sink
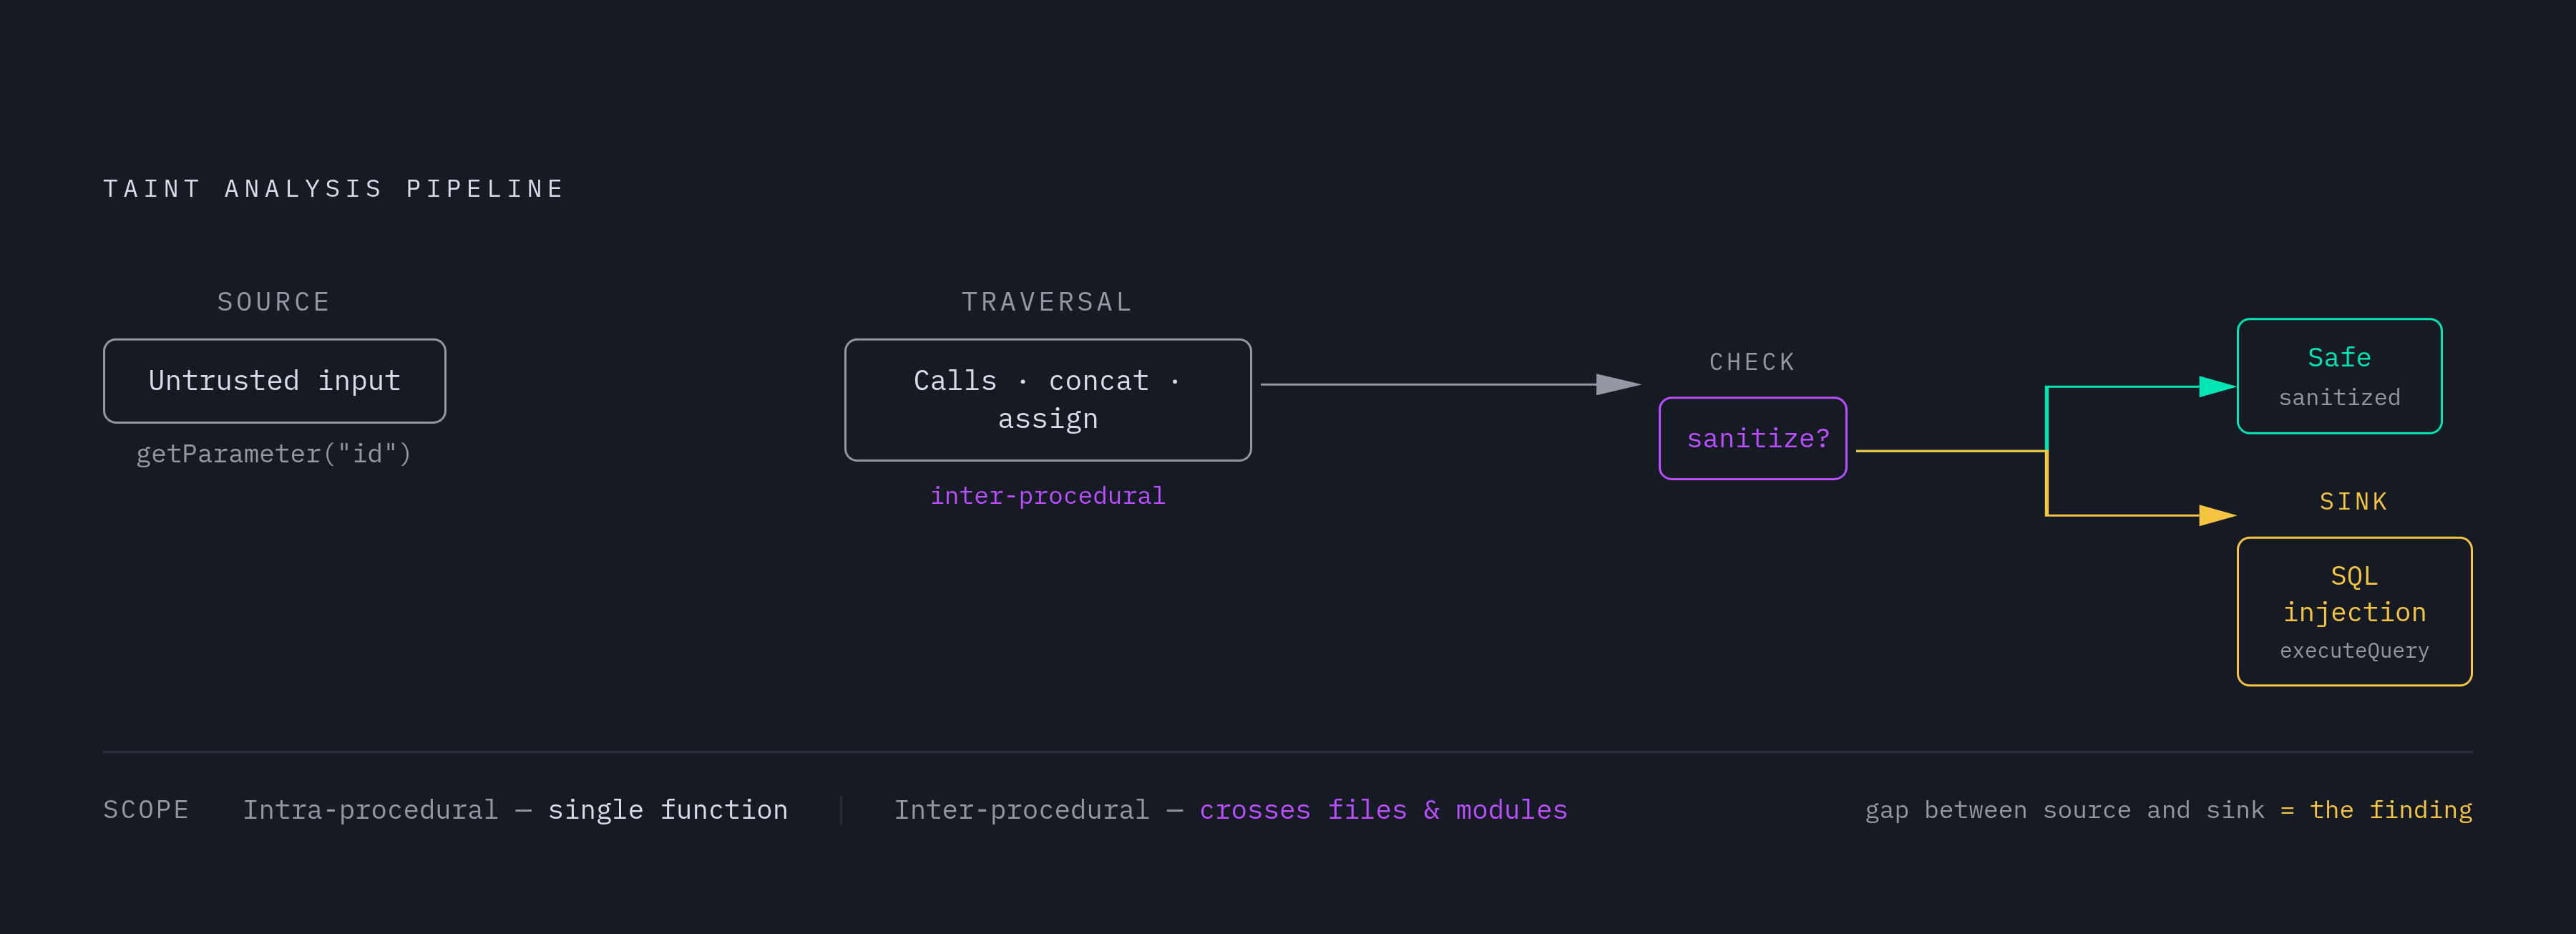
Taint analysis is the mechanism that separates data-flow-aware tools from pattern matchers. It marks a piece of data the moment it enters an application from an untrusted source, then tracks whether that marked data reaches a dangerous destination without getting sanitized first. Everything downstream in this piece, every tool comparison and every capability gap, traces back to how well a given tool performs this one operation.
The untrusted origins in this model are called sources: HTTP request parameters, file uploads, environment variables, and responses coming back from external services. The dangerous destinations are called sinks: SQL query executors, shell command runners, template renderers, and file write operations. A taint analysis engine's entire job is building the path between the two and checking whether anything sanitizes the data along the way.
Picture a Java web application handling a request. A value comes in through HttpServletRequest.getParameter("id"). From there, the taint analysis engine follows that value as it passes through method calls, gets concatenated into other strings, and gets reassigned to new variables, all the way until it reaches Statement.executeQuery(sql). If no parameterized query sits between the entry point and that execution call, and nothing sanitizes the value in between, the tool flags the path as a SQL injection, marking it at the door, following it through every transformation, and checking what's waiting at the exit.
The depth of that following matters as much as the fact of it happening, because local, intra-procedural data flow only considers connections within a single function. It has no visibility into how data moves between functions, through object properties, or across the rest of the program. Global, inter-procedural data flow follows data across function boundaries, across files, across entire modules, including through string manipulation that produces new derived values at runtime. Taint tracking layers on top of that by adding the edges that model whether a value at runtime might be derived from another value elsewhere in the graph, extending the analysis further than plain control-flow tracing goes. Any technical buyer evaluating a vendor's claim of "data-flow tracing" has one question that cuts through the marketing: does the taint tracking cross function and file boundaries, or does it stop at the edge of a single function.
Why cross-file taint tracking matters commercially
Whether a tool crosses file boundaries is the detail that decides whether it's commercially useful or merely well-marketed. A threat model that includes second-order injection, where the source of the tainted data and the sink that consumes it live in different files or modules entirely, will slip straight past a tool limited to intra-procedural analysis. The vulnerability exists. The tool simply never sees it, because it never looks past the function it started in.
SQL injection is a direct example. A request parameter often has to pass through ORM abstractions spread across several files before it ever reaches a call that executes a query, and a tool that can't follow it that far will miss the injection. Reflected cross-site scripting behaves the same way: a value coming back to the user frequently passes through several layers of templates before it lands in a rendering sink, and each of those layers is a place a shallow tool loses the thread. Server-side request forgery compounds the problem further, because an attacker can build up a URL or hostname piece by piece across several helper functions before it ever reaches the HTTP client that makes the request. Insecure deserialization pushes the requirement even deeper: an externally controlled byte stream has to be traced down into a deserialization sink buried inside a library call chain, a task that pattern-only tools miss routinely rather than occasionally. Hardcoded secrets fit this same pattern, because white-box scanning can reach past the current code and into configuration files and version control history, so it can recover credentials that were committed, later deleted, but still sit readable in git history.
Under-powered taint analysis carries a cost beyond the vulnerabilities it misses. If a tool isn't tuned for precision, its false positive rate can make a team's triage process unworkable, and that volume of noise erodes developer trust in the tool itself. The expense of that imprecision isn't confined to the bugs that slip through. That imprecision also causes real bugs to get dismissed because they're buried in a pile of alerts nobody has time to sort through one by one. So you shouldn't just ask a vendor whether a tool performs taint analysis. It's whether that taint analysis crosses file and function boundaries with enough precision to produce a queue a team can actually work through.
Data-Flow Tracing in Leading SAST Tools
The tools that credibly deliver inter-procedural, cross-file taint analysis differ from one another in language coverage, extensibility, and where they sit inside a team's workflow. The right choice depends on the stack and the threat model in front of a buyer.
GitHub CodeQL, distributed through GitHub Advanced Security, treats an entire codebase as a queryable database and builds a full semantic representation of it, which is what lets it trace taint across functions, files, and modules rather than stopping at a single function's edge. It follows potentially dangerous data from sources like user input, file reads, and network data to sinks like database queries, command execution, and file writes, and it flags the paths where that data arrives at a sensitive operation unsanitized. As of April 21, 2026, CodeQL lets engineers define custom sanitizers and validators using data extensions, a models-as-data approach that spans C/C++, C#, Go, Java/Kotlin, JavaScript/TypeScript, Python, Ruby, and Rust. Before that update, the same customization required writing full CodeQL queries by hand, which kept the barrier to entry high for most teams. CodeQL version 2.25.4, released May 5, 2026, added JavaScript/TypeScript support for @vercel/node serverless handlers, extending detection of reflected XSS, SSRF, SQL injection, and command injection into Vercel deployments. An earlier release, CodeQL CLI 2.24.0 on January 26, 2026, added a sanitizer to the Java SSRF query that removes alerts when a regular expression check already verifies a value is safe, a small but concrete example of the kind of precision tuning that cuts false positives directly.
Semgrep takes a different route. Its open-source engine matches patterns using a clean rule syntax and a large community registry, and if you tune your rulesets well, it runs a lower false positive rate than older legacy tools. Semgrep Pro adds cross-file taint analysis and advanced secrets scanning with validation, and the open-source Community Edition doesn't carry these in full. The structural limit is that Semgrep's pattern-matching foundation doesn't reach the same depth of inter-procedural taint tracking that CodeQL achieves, so a vulnerability that requires following data through multiple function calls spread across files is more reliably caught by CodeQL. Semgrep answers that trade-off with a broader community ruleset and faster iteration, which is a different bet on where value comes from, not a flaw.
Checkmarx One runs static analysis alongside data-flow analysis, custom queries, incremental scanning, and policy controls built for enterprise use. Its Best Fix Location feature points developers at the single code change that resolves multiple vulnerability flows at once, so when a codebase gets large enough that triage becomes its own project, this helps with prioritization. Pricing runs around $40,000 a year, which signals the scale of organization it's built for rather than anything about its technical ceiling.
Black Duck Coverity targets deep defect detection across a wide range of languages and frameworks, and its interprocedural dataflow analysis traces issues across function boundaries, execution paths, and calling contexts, built specifically to catch the complex vulnerabilities that simpler tools pass over.
GitLab Advanced SAST performs cross-file, cross-function taint analysis that follows untrusted input through an application's entire flow, catching what single-file scanners miss. It's built for teams already working inside the GitLab DevSecOps platform, needs the Ultimate tier, and because its integration is native, you don't have to run separate scanning infrastructure alongside GitLab itself.
Snyk Code uses data-flow analysis to track tainted input across function boundaries, flagging SQL injection, XSS, command injection, path traversal, SSRF, and hardcoded credentials. Its SAST engine, DeepCode AI, combines symbolic analysis with generative AI trained on a large corpus of data-flow cases across a broad range of languages, and it sits inside a wider platform that also covers open source dependencies, container images, and infrastructure as code, which matters for teams looking to consolidate several security layers under one vendor.
Mobile applications have their own reference point in FlowDroid, a context-, flow-, field-, object-sensitive, and lifecycle-aware static taint analysis tool built for Android. When the subject turns to Android-specific data flow, the field cites this as the primary academic and practitioner touchstone for taint analysis in mobile apps.
The reachability gap between a flagged pattern and a proven exploit
Even a static taint analysis engine that crosses every file and function boundary can't answer one question: whether the flagged code path is actually reachable when the application is running. A dead code path that nothing ever calls, or a path sitting behind an access control check the static tool has no way to model, will still generate a finding. The engine sees the path on paper. It has no way of knowing whether an attacker could ever actually walk it.
That gap is why source code-assisted penetration testing has become its own distinct discipline. Reading the code to understand the attack surface is a far more powerful starting point than probing an application blind from the outside, but the code alone can't prove something is exploitable. Only runtime validation closes that last step. For a buyer, the practical consequence is this: a taint path a SAST tool flags in its output is a hypothesis, not a finding. Proving the finding out requires showing that the path is actually reachable and that the dangerous operation executes with data an attacker genuinely controls.
That's the line that separates a scanner from a penetration test, and it's increasingly the line compliance auditors and enterprise customers ask about directly when they review a security report. A list of flagged paths doesn't answer the question they're actually asking, which is whether any of it can really be exploited.
Tools that combine static data-flow tracing with runtime exploitation to prove findings
A newer category of tool has formed to close that gap: it pairs static taint analysis with live exploitation against a running application. A finding backed by both the code-level trace and a working runtime exploit is far harder to argue with than a static finding alone, and it's the only kind of finding that holds up with confidence in front of a security auditor or an enterprise customer.
Stingrai Snipe runs dynamic testing against a live application, grey-box testing with credentials for each user role, and white-box source review with data-flow tracing to dangerous sinks, and it combines all three channels inside a single engagement instead of treating them as separate tools.
Intruder's AI pentesting runs fully autonomous agents against web applications on demand, using a white-box approach that reads source code directly instead of probing only from the outside, which gives the agents full knowledge of how endpoints and APIs are actually built. The agents map endpoints automatically without requiring a schema upload, detect IDORs and business logic flaws, and chain smaller issues together into more complex exploits, with every finding validated against the live application before it reaches a report.
Shannon, built by Keygraph, is a white-box pentester that pairs source code analysis with browser automation and command-line tools, letting it find bug classes that only surface once you can see the code itself. It scored nearly all exploits on a cleaned, hint-free white-box variant of the XBOW benchmark.
Strix is an open-source agentic security platform built around a graph model that arranges specialized agents into workflows covering recon, exploitation, and post-exploitation. It runs code dynamically inside an isolated Docker sandbox and validates every finding with a working proof-of-concept exploit before it ever appears in a report.
Trace, the platform behind this publication, fits into this same category: it integrates directly with source code repositories to trace data flow across an entire attack surface, including the second-order injection paths that static analysis tools alone routinely miss, and verifies each finding with a working exploit before it reaches an audit report. Across every tool in this category, the shared premise is the same one that opened this piece: a finding only means something once someone, or something, has proven it.